Meter Types - retired
Amberflo provides a comprehensive set of Meter Types that enable the creation of a meter to track and aggregate usage instrumentation.
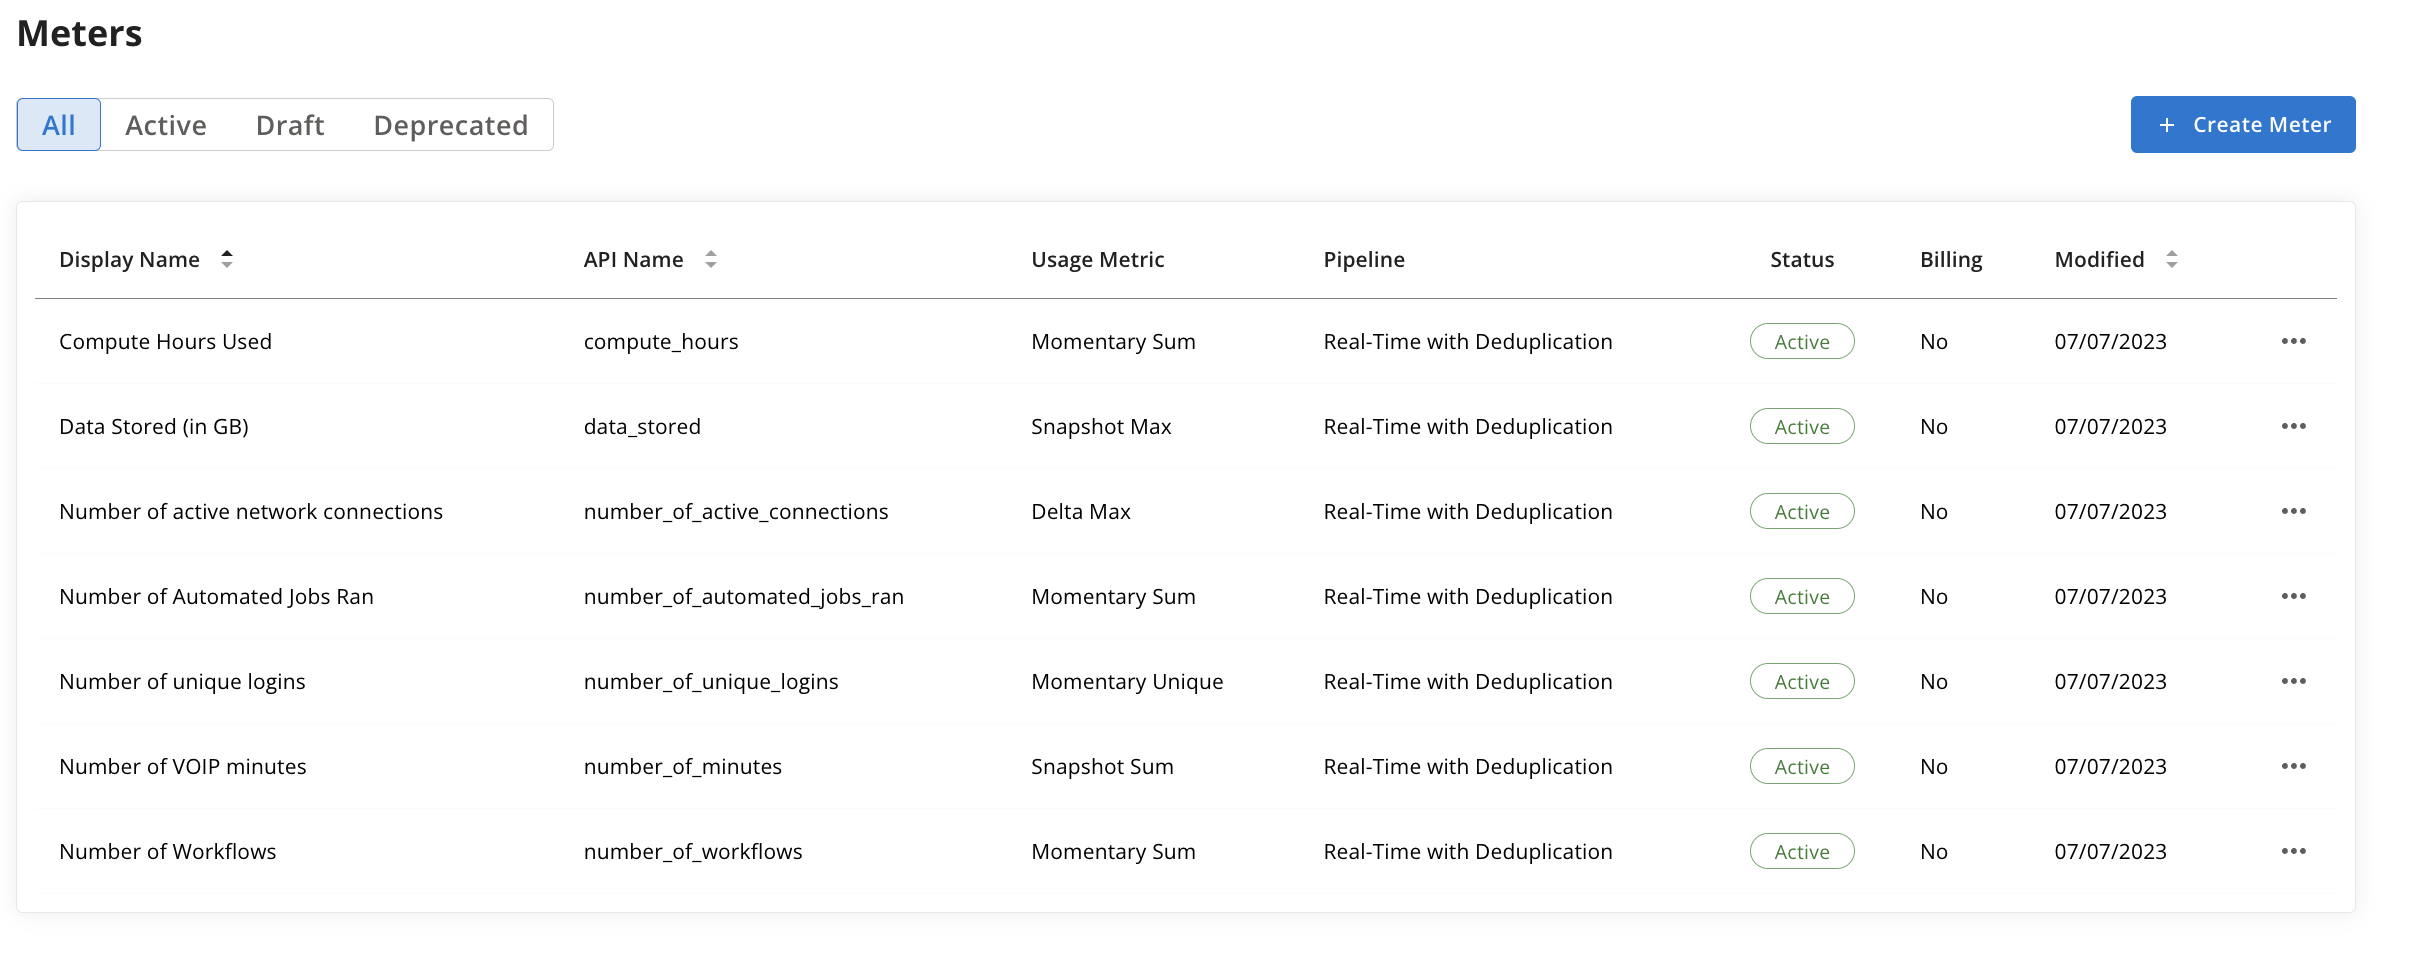
Select a meter type based on the data type and tracking method. Amberflo Cloud Metering Service automatically collects, persists, and aggregates the meter data in real-time. Meters are defined based on the Usage Metric and the Pipeline that are selected as shown in the meter list view below.
Sum
Report a number or amount at a distinct time. Amberflo will compute the total of all values reported within a selected time interval per customer.
Resource
A dynamic resource is consumed by the customer momentarily. Examples of such resources are API calls, bytes uploaded or downloaded, reads, writes, etc.
Meter Calculation
This meter tracks and provides the usage events of such a resource by the customer.
Meter Value
The incremental change since the previous ingestion event (aka delta).
Aggregation: sum
Use Cases
A meter called API Calls reports a value of 1 every time the API endpoint is called. For any given time interval, you want to know how many API Calls were made during that interval.
A meter called Files Opened reports a value of 1 every time a file is opened. For any given time interval, show the total number of files were opened.
A meter called Bytes_Written reports a value of [the number of bytes written] every time a Write operation is executed. For any given time interval, show the total number of Bytes written.
Other examples: bytes read, bytes written, data volume, projects.
Example Calculation
Given:
- Meter Definition created with name: ApiCalls. In this example, the meter is ingested at real time whenever a call is made to an API.
When the following events are created:
- <time(day 1, 1:10), meterName(ApiCalls), customer(Stark), value(1)>
- <time(day 1, 1:15), meterName(ApiCalls), customer(Stark), value(1)>
- <time(day 1, 1:45), meterName(ApiCalls), customer(Stark), value(1)>
- <time(day 1, 1:45), meterName(ApiCalls), customer(Wayne), value(1)>
- <time(day 1, 1:55), meterName(ApiCalls), customer(Stark), value(1)>
- <time(day 2, 1:00), meterName(ApiCalls), customer(Stark), value(1)>
- <time(day 2, 9:00), meterName(ApiCalls), customer(Stark), value(1)>
- <time(day 3, 1:15), meterName(ApiCalls), customer(Stark), value(1)>
- <time(day 3, 3:45), meterName(ApiCalls), customer(Stark), value(1)>
- <time(day 4, 1:45), meterName(ApiCalls), customer(Wayne), value(1)>
- <time(day 4, 23:30), meterName(ApiCalls), customer(Stark), value(1)>
Then:
- Query range of day 1 to day 1 for customer Stark -> value 4
- Query range of day 1 to day 1 for customer Wayne -> value 1
- Query range of day 2 to day 2 for customer Stark -> value 2
- Query range of day 3 to day 3 for customer Stark -> value 2
- Query range of day 1 to day 3 for customer Stark -> value 8
- Query range of day 1 to day 3 for all customers -> value 9
- Query range of day 4 to day 4 for customer Stark -> value 1
- Query range of day 4 to day 4 for all customers -> value 2
Max
Report a number or amount at a distinct time. Amberflo will compute the max value received within a time interval per customer.
Resource
A static resource is assigned to a customer over a long period of time. Examples: storage consumed, VMs used, workflow count, etc.
Meter Calculation
This meter tracks the scale or frequency a resource is being assigned to a customer over time. In other words, the meter tracks the usage rate or max utilization.
Meter Value
The observed value in its current state (aka snapshot) as opposed to the change since the previously ingested event. In other words, a snapshot is the total portion of the resource dedicated to the customer.
Aggregation: max
Use Cases
A meter called Compute Instances reports a value of 1 for every time a compute instance is started. For any given time interval, show the max of all instances that were created.
A meter reports the value of the size of a storage bucket. For any given time period, show the max storage value.
Other examples: compute instances, storage bucket, max CPU usage, max connections, max production tickets.
Example Calculation
Given:
- Meter Definition created with name: CPU usage
When the following events are created:
- <time(day 1, 1:10), meterName(CpuUsage), customer(Stark), value(8)>
- <time(day 1, 1:15), meterName(CpuUsage), customer(Stark), value(3)>
- <time(day 1, 1:55), meterName(CpuUsage), customer(Stark), value(9)>
- <time(day 2, 1:02), meterName(CpuUsage), customer(ENCOM), value(6)>
- <time(day 2, 1:25), meterName(CpuUsage), customer(Stark), value(4)>
- <time(day 2, 9:00), meterName(CpuUsage), customer(Stark), value(1)>
Then:
- Query range for the entire usage of day 1 at 1:00 to day 1 at 2:00 -> value 9
- Query range for the entire usage of day 1 at 2:00 to day 1 at 3:00 -> value 0
- Query range for the entire usage of day 1 at 0:00 to day 2 at 0:00 -> value 9
- Query range for usage of day 2 at 1:00 to day 2 at 2:00 of customer ‘Stark’ -> value 4
- Query range for usage of day 2 at 1:00 to day 2 at 2:00 of customer ‘ENCOM’ -> value 6
- Query range for the entire usage of day 2 at 1:00 to day 2 at 2:00 -> value (6 + 4) -> value 10
- Query range for the entire usage of day 2 to day 3 -> value (6 + 4) -> value 10
Unique Count
Report events with a dimension configured as the uniqueDimension parameter in the meter definition. Amberflo will compute the number of unique events within the time interval. This meter only accepts a value of 1 since it is mainly tracking the occurrence of an event.
Resource
A static resource is assigned to a customer. Examples: VMs used, workflow count, user login, etc.
Meter Calculation
This meter tracks the scale or frequency a resource is being assigned to a customer over time. In other words, the meter tracks the distinct usage rate.
Meter Value
This meter can only accept a value of 1 since it is mainly tracking the occurrence of an event.
Aggregation: distinct max
Example
Meter reports user login events. Same user can log in multiple times. For any given time interval, show unique user login count.
Other examples: user logins, page likes.
Example Calculation
Given:
- Meter Definition created with name: UniqueUserLogins and uniqueDimension: userId
When the following events are created:
- <time(day 1, 1:10), meterName(UniqueUserLogins), customer(Wayne), userId(batman), value(1)>
- <time(day 1, 1:15), meterName(UniqueUserLogins), customer(Wayne), userId(robin), value(1)>
- <time(day 1, 1:45), meterName(UniqueUserLogins), customer(Wayne), userId(joker), value(1)>
- <time(day 1, 1:55), meterName(UniqueUserLogins), customer(Wayne), userId(batman), value(1)>
- <time(day 2, 1:00), meterName(UniqueUserLogins), customer(Wayne), userId(joker), value(1)>
- <time(day 2, 9:00), meterName(UniqueUserLogins), customer(Wayne), userId(robin), value(1)>
- <time(day 3, 1:15), meterName(UniqueUserLogins), customer(Wayne), userId(batman), value(1)>
- <time(day 3, 3:45), meterName(UniqueUserLogins), customer(Wayne), userId(batman), value(1)>
- <time(day 4, 23:30), meterName(UniqueUserLogins), customer(Wayne), userId(robin), value(1)>
Then:
- Query range of day 1 to day 1 -> value 3
- Query range of day 2 to day 2 -> value 2
- Query range of day 3 to day 3 -> value 1
- Query range of day 1 to day 3 -> value 3
- Query range of day 4 to day 4 -> value 1
Duration
A long lasting event is when the start-time of an event is different from the end-time of the event. The count remains active until a new meter event decrements it. The value of 1 is carried over to the next hour until the event is ended. Duration is tracked using the Event ID Dimension. You can also specify a timeout period which will set an upper limit on the duration.
Resource
A static resource is assigned to a customer over a long period of time. Examples: VM instances, active connection, etc. Another way of looking at this is resource leasing.
Meter Calculation
This provides how long a resource was leased to a customer.
Meter Value
A value of 1 marks the start of an event and 0 marks the end.
Aggregation: sum of hours
Use Cases
Meter reports a value of 1 when a compute instance is started and a value of 0 when a compute instance is shut down. Get the duration of how long the VM was running in hours.
Other examples: workflow lifetime, task duration, help desk turnaround time, function duration.
Example Calculation
Given:
- Meter Definition created with
- name = ComputeInstances
- eventIdDimension = clusterId
- timeout (max duration) = 4 hours
When the following events are created:
- <time(day 1, 1:10), meterName(ComputeInstances), customer(ENCOM), clusterId(1), value(1)>
- <time(day 1, 1:15), meterName(ComputeInstances), customer(ENCOM), clusterId(2), value(1)>
- <time(day 1, 1:45), meterName(ComputeInstances), customer(ENCOM), clusterId(2), value(0)>
- <time(day 1, 1:55), meterName(ComputeInstances), customer(ENCOM), clusterId(1), value(0)>
- <time(day 2, 1:00), meterName(ComputeInstances), customer(Stark Industries), clusterId(1), value(1)>
- <time(day 2, 9:00), meterName(ComputeInstances), customer(Stark Industries), clusterId(1), value(0)>
- <time(day 3, 1:15), meterName(ComputeInstances), customer(ENCOM), clusterId(4), value(1)>
- <time(day 3, 3:45), meterName(ComputeInstances), customer(ENCOM), clusterId(4), value(0)>
- <time(day 4, 23:30), meterName(ComputeInstances), customer(ENCOM), clusterId(5), value(1)>
Then:
- Query range of day 1 to day 1 -> value 1.25
- Query range of day 2 to day 2 -> value 4 # timeout exceeded
- Query range of day 3 to day 3 -> value 2.5
- Query range of day 1 to day 3 -> value ENCOM(5.25), Stark Industries(2.5)
- Query range of day 4 to day 4 -> value 0.5
- Query range of day 5 to day 5 -> value 3.5 # carried over from day 4 and timed out
Running Total
This also tracks long lasting events except it focuses on the count of active instances or running total of all events assigned to a customer as opposed to reporting a time duration. This can be incremented or decremented.
You need to specify the event ID dimension** in the meter definition to associate meters to an event and resource. Once the timeout period expires, the event will be decremented automatically.
Resource
A static resource is assigned to a customer over a long period of time. Examples: VMs used, active connections, etc.
Meter Calculation
This provides the number of resources assigned to a customer.
Meter Value
Overall, tracks the net current running total of instances that were up. It is an in-use counter where the delta can be an increment or decrement.
Aggregation: max
Use Cases
A meter reports the active connections at the start of every hour.
Other examples: active VMs, active tickets.
Example Calculation
Given:
- Meter Definition created with
- name = ActiveConnections
- eventIdDimension = instanceId
- timeout = 4 hours
When the following events are created:
- <time(day 1, 1:10), meterName(ActiveConnections), customer(ENCOM), instanceId(1), value(1)>
- <time(day 1, 1:15), meterName(ActiveConnections), customer(ENCOM), instanceId(2), value(1)>
- <time(day 1, 1:20), meterName(ActiveConnections), customer(ENCOM), instanceId(3), value(1)>
- <time(day 1, 1:30), meterName(ActiveConnections), customer(ENCOM), instanceId(1), value(-1)>
- <time(day 1, 1:45), meterName(ActiveConnections), customer(ENCOM), instanceId(2), value(-1)>
- <time(day 1, 1:50), meterName(ActiveConnections), customer(ENCOM), instanceId(3), value(-1)>
- <time(day 2, 1:00), meterName(ActiveConnections), customer(Stark Industries), instanceId(1), value(1)>
- <time(day 2, 9:00), meterName(ActiveConnections), customer(Stark Industries), instanceId(1), value(-1)> # ignored due to timeout
- <time(day 3, 1:15), meterName(ActiveConnections), customer(ENCOM), instanceId(4), value(1)>
- <time(day 3, 3:45), meterName(ActiveConnections), customer(ENCOM), instanceId(4), value(-1)>
- <time(day 4, 23:30), meterName(ActiveConnections), customer(ENCOM), instanceId(5), value(1)>
Then:
- Query range of day 1 to day 1 -> value 3
- Query range of day 2 to day 2 -> value 1
- Query range of day 3 to day 3 -> value 1
- Query range of day 1 to day 3 -> value ENCOM(4), Stark Industries(1)
- Query range of day 4 to day 4 -> value 1
- Query range of day 5 to day 5 -> value 1 # carried over from day 4 and timed out
Max-Persist
Same as Max meter except the previous max value is persisted (carried forward) if no value is reported for a subsequent time interval. The max value is persisted until a new event arrives, or Timeout occurs. At timeout, the value is set to 0. The events are matched by the value of the Event ID Dimension.
Resource
A static resource is assigned to a customer over a long period of time. Examples: storage consumed, VMs used, workflow count, etc.
Meter Calculation
This meter tracks the scale or frequency a resource is being assigned to a customer over time. In other words, the meter tracks the usage rate or max utilization.
Meter Value
The observed value in its current state (aka snapshot) as opposed to the change since the previously ingested event. In other words, a snapshot is the total portion of the resource dedicated to the customer.
Aggregation: max
Use Cases
Example 1: You report the size of a storage bucket every time it is changed with no set interval. Max-Persist will carry the last reported value forward. The storage bucket (e.g. AWS S3) id is the EventId. Even if there is no new event reported, you can keep the usage (and billing) carried over (since events are sent only when a change occurs, and reports the total storage used.
Example 2: You wish to meter hard drives' storage used for a server. Every hour you report each hard drive’s in-use storage. The hard drive id is the EventId. You can set the timeout to how long you want to keep on charging if there is no new event reported (e.g. 1 month).
Example Calculation
Given:
- Meter Definition created with name: DataStorage
- timeout (max duration before meter value reset to 0) is 4 hours
When the following events are created:
- <time(day 1, 1:10), meterName(DataStorage), customer(Stark), value(8)>
- <time(day 1, 1:15), meterName(DataStorage), customer(Stark), value(3)>
- <time(day 1, 1:55), meterName(DataStorage), customer(Stark), value(9)>
*<time(day 1, 7:55), meterName(DataStorage), customer(Stark), value(11)>- <time(day 2, 1:02), meterName(DataStorage), customer(ENCOM), value(6)>
- <time(day 2, 1:25), meterName(DataStorage), customer(Stark), value(4)>
- <time(day 2, 9:00), meterName(DataStorage), customer(Stark), value(1)>
Then:
- Query range for the entire usage of day 1 at 1:00 to day 1 at 2:00 -> value 9
- Query range for the entire usage of day 1 at 2:00 to day 1 at 3:00 -> value 9 (value persisted)
- Query range for the entire usage of day 1 at 6:00 to day 1 at 7:00 -> value 0 (value timed out and reset)
- Query range for usage of day 2 at 1:00 to day 2 at 2:00 of customer ‘Stark’ -> value 4
- Query range for usage of day 2 at 1:00 to day 2 at 2:00 of customer ‘ENCOM’ -> value 6
- Query range for the entire usage of day 2 at 1:00 to day 2 at 2:00 -> value (6 + 4) -> value 10
Updated 8 months ago